Valuing the SDGs for Localization in Patiala, India

The Community Systems Foundation’s OpenCities Institute worked with the City of Patiala in Punjab, India to develop a proof-of-concept city-level SDG data system, demonstrating the simplicity, feasibility, and value of subnational SDG monitoring through data visualization design and technology. This project was part of the LDA-SI 2018-2019 microgrant program.
Written by Ruchi Varma, Program Manager - Urban Development, OpenCities Institute, Community Systems Foundation. Editing by Sandra Ruckstuhl, Jessica Espey, and Jay Neuner. Design by Micha Dugan, Ryan Swaney, and Jay Neuner. Project support by Jon Kapp, Dr. Jeeveeta Agnihotri, Seth Davis, Jayati Narain, and Geraud Bablon. OpenCities Institute is grateful for the support and inputs shared by Mr. Kumar Amit IAS, Deputy Commissioner, Patiala District Administration; Mr. Gurpreet Singh Khera, Commissioner, and Dr. Ankur Mahindroo, Ex. Joint Commissioner, Municipal Corporation, Patiala. The team is also grateful to Prof. Geetam Tiwari and her project team at Transportation Research & Injury Prevention Programme (TRIPP) at Indian Institute of Technology, Delhi for a continued collaboration and guidance.


Table of contents
Abstract | Problem | Solution | Building Process | Strengths and Weaknesses | Lessons | References and Additional Resources | Annexes | Endnotes
Abstract
With no precedents and no impetus from central and state governments to use the language of the Sustainable Development Goals (SDGs), most Indian cities are resisting efforts to adopt them. They view the UN resolution laying out these goals, Agenda 2030, as an additional and foreign framework competing with their day to day priorities. And yet city-level SDG data and monitoring platforms can be used to align city development efforts across the country and ensure that no one is left behind. To maximize the value of SDG localization in Indian cities, Community Systems Foundation’s (CSF) OpenCities Institute (OCI) worked with the city of Patiala in Punjab1 to develop a proof-of-concept city-level SDG data system, which includes a model indicator list and data dashboard and provides a one-stop visualization tool to aid the city’s decision-making and planning efforts.
This brief outlines an easy-to-use, four-step methodology tested in Patiala to demonstrate to cities the simplicity, feasibility, and value of subnational SDG monitoring through data visualization design and technology. It proposes ways to kickstart localizing the goals with “what is available” rather than “what is missing.” The aim is to develop a long-term view for sustainability, to optimize municipal efficiency, and to bolster inter-departmental and citizen participation. This is done by setting a precedent for SDG localization for Indian cities that have less exposure to national programs, technical expertise, and the international stage. This model provides a roadmap for initiating a full-scale city-level SDG observatory, inclusive of a living reference data dashboard, which can be adapted to other cities irrespective of their size, geographic location, and existing capacities.

The traveling exhibition Our Patiala 2030 generated interest, suggestions, and feedback from the community to bolster SDG oriented action. Courtesy of Ruchi Varma for OCI.
Problem
In 2018, at the UN High-level Political Forum (HLPF), Shri Hardeep Puri, Union Minister of State for Housing and Urban Affairs (MoHUA), stated, “The Millennium Development Goals succeeded largely because China lifted hundreds of millions of people out of poverty. The success of the Sustainable Development Goals depends entirely on India and we are determined to [achieve that]”2.

Box 1. Responsibilities of Municipalities (Article 243-W/Twelfth Schedule)
1. Urban planning, including town planning
2. Regulation of land use and construction of buildings
3. Planning for economic and social development
4. Roads and bridges
5. Water supply for domestic, industrial, and commercial purposes
6. Public health, sanitation, conservancy, and solid waste management
7. Fire services
8. Urban forestry, protection of the environment and promotion of ecological aspects
9. Safeguarding the interests of weaker sections of society, including the handicapped and mentally retarded (Editor’s note: This language is reproduced directly from the Constitution of the Republic of India and does not reflect contemporary practice for referring to people with disabilities.)
10. Slum improvement and upgradation
11. Urban poverty alleviation
12. Provision of urban amenities and facilities, such as parks, gardens, playgrounds
13. Promotion of cultural, educational, and aesthetic aspects
14. Burials and burial grounds; cremations, cremation grounds, and electric crematoriums
15. Cattle pounds; prevention of cruelty to animals
16. Vital statistics, including registration of births and deaths
17. Public amenities, including street lighting, parking lots, bus stops, and public conveniences
18. Regulation of slaughterhouses and tanneries

Facing rising urbanization, India is at an opportune moment to focus on long-term goals of sustainability and livability and on the evidence-based governance and policymaking practices that will help cities align and achieve the Sustainable Development Goals (SDG). Some 57 percent3 of the total urban population in India lives in small and medium-sized cities, with city-by-city populations ranging from 100,000 to 2 million people. But on the ground, city administrations are skeptical about the SDGs and perceive the Global Goals as a framework that is imposed and irrelevant to their own priorities. In this context, three major questions arise: How can cities in India align their development priorities with the SDGs and acknowledge their usability as a guiding framework? How can data-driven approaches assist the adoption of SDG localization and mainstream the goals to strengthen evidence-based culture within the municipal body? How can such approaches make way for best practices to fast-track implementation of the SDGs and support for the Voluntary National Review (VNR) process by state governments?
The City of Patiala (founded in 1963), the administrative headquarters of Patiala district of Punjab, is the fourth largest city of Punjab. It has an area of 50.11 square kilometers, 60 wards, and a population of 406,192. The Patiala Municipal Corporation (MC) is responsible for governing, developing, and managing the city. The Patiala Metropolitan Area, with a total population of 446,246, is managed by the Patiala Urban Planning and Development Authority (PDA), a state agency. This includes Patiala MC and neighboring villages and settlements. The Patiala Municipal Corporation is responsible for providing urban municipal services. Under the 74th Constitutional Amendment (1992), also known as the Nagarpalika Act, urban local bodies (ULBs) play a role in the planning and implementation of 18 functions4 broadly relating to public health, welfare, regulatory framework, public safety, public infrastructure, and other associated development activities (see Box 1). However, due to a lack of fiscal autonomy, most small- and medium-sized cities like Patiala are mostly dependent on fiscal transfers from Government of India and state governments to perform their obligatory duties. In India, urban local governments are governed by the provisions of the State municipal acts. Every State has its own municipal act derivative of the central government’s decision to entrust state legislatures with the decision on the structure, functions and powers of the local governments. The states constitute urban local government institutions/municipalities for the maintenance and planned development of urban areas where the objective is to ensure that suitable levels of infrastructure and services are available to the citizens5.
In 2011, an Expert Committee on Indian Urban Infrastructure and Services (HPEC) observed that cities in India, under rapid urbanization pressures, are among the weakest in the world, both in terms of capacity to raise resources and financial autonomy. Due to this, municipal authorities are only responding to the daily needs and “firefighting” issues rather than engaging in any long-term planning and vision.
In the 2017 SDG Index and Dashboards Report produced by the Sustainable Development Solutions Network (SDSN) and Bertelsmann Stiftung, India is ranked at 116 out of 157 countries6 in the assessment of country performance towards achieving the ambitious SDGs. While NITI Aayog, National Institution for Transforming India, a policy think tank of the Government of India, has been entrusted with the task of coordinating the SDGs for India and ensure monitoring at the highest level, neither the central or state governments have offered any indications yet on the SDGs to cities like Patiala. Therefore, small cities currently do not recognize the potential value of using Agenda 2030 as a framework for their own development.
Further, municipalities like Patiala have limited technical planning capacity, resources, and systems that can support global goals. In this setting, the ambitious vision that has been finalized at the international stage intimidates these cities. In addition, they have no immediate access to their own data to engage in any kind of vision planning and strategy development exercises. To add to the challenge, the capacity to use existing data or collect new datasets is lacking, and urban local bodies do not possess the autonomy to define priorities and processes across development sectors. While they may use national-level indicators and available service-level benchmarks as guiding documents, they have no precedent or push to monitor their own goals with relevant benchmarks.
SOLUTION
Between May and November 2018, CSF’s OCI and the City of Patiala valorized the SDG localization process by employing data visualization technology and a simple, step-by-step methodology rooted in what the city wants. The following outputs were the product of that initiative:
- SDG and SDG-related indicator registry for urban local bodies in India (Annex A; Annex B)
- SDG-oriented local indicators for Patiala (Annex C)
- SDG data dashboard (version 2 available online here; Annex D)
A master list for the SDG and SDG-related indicator registry for urban local bodies in India was developed by OCI under the LDA-SI microgrant, integrating indicators from the Inter-agency and Expert Group on SDG Indicators (IAEG-SDGs)7, literature available from the cities featured in SDSN’s U.S.A. Sustainable Cities Initiative (USA-SCI), and relevant documentation for cities in India. This included the Liveability Indicators, Service Level Benchmarks, etc. The indicators selected have been mapped to the 18 municipal functions under the Twelfth Schedule so that the cities can see a practical alignment of the Global Goals with their duties and responsibilities. This list can be used by a large group of stakeholders such as citizens, academia, and urban governance stakeholders in a city.
Indicators from the master list were shortlisted by OCI to respond to the priorities and immediate needs raised by the city of Patiala. This master list of SDG localization indicators for Patiala comprises of 50 indicators across issues of Solid Waste Management, Air Pollution, and Parking. This list gives an overview to the city administrators, such as the commissioner and joint commissioner, on what data could be measured or reported in order to make evidence-based decisions. The administrator also then has the onus to delegate the responsibility of providing the required information and data within various departments, or supporting coordination with relevant parastatals and state departments.
The mock SDG data dashboard is updated with relevant datasets and information provided by the city on the identified indicators. The selection of the Key Performance Indicators (KPIs) was an output of the availability of data. This information was later translated by OCI into visualization with maximum relevance, so that it is easy to understand and is understood by decisionmakers to inspire interest and action. A data dashboard here serves as a powerful planning and advocacy tool for local SDG implementation. Even in its mock status, the current dashboard prototype can be used by a wide range of city users to get a one-stop overview of the city’s priorities. Through proactive dissemination, it also drives the citizen to demand accountability and engage with urban local bodies for better cities and their wellbeing. The city administrators can use this output as a living reference dashboard to emphasize tight integration across city departments, and also generate further interest and curiosity to use Agenda 2030 as a guiding tool.
Building Process
Between January and April 2018, OCI supported the Transportation Research Injury Prevention Program (TRIPP) at the Indian Institute of
Technology, Delhi with an ongoing project called “SDG Oriented Planning and Design in Small Cities” supported by International Association with Traffic Safety Sciences (IATSS) Japan. OCI developed a mock dashboard harnessing road accident data collected by TRIPP in Patiala (Figure 1). All data was collected and analyzed by the TRIPP team. This also gave way to the development of a preliminary SDG Data Dashboard, visualizing SDG 3: Good Health and Well-being, SDG 9: Industry, Innovation and Infrastructure and SDG 11: Sustainable Cities and Communities as the baselines of the current state of mobility in the city and introducing alignment and linkages of transport-related SDGs between various goals. Through this visual representation, the city administrators were able to comprehend the gravity of the issue and understand the need for a coordinated effort and participation of more than one department to resolve the issue.
Figure 1. Mock Dashboard of Road Accident Data

This SDG Localization Package, developed by OCI under a grant from SDSN’s Local Data Solutions Initiative (LDA-SI), includes a four-step approach:
1. Define the city priorities
2. Map selected city priorities to the SDGs
3. Identify local indicators and report
4. Adoption of data visualization tools and dashboards
The project timeline is detailed in Figure 2.
Figure 2. Timeline of SDG Localization Project


Define the city priorities
1a. Establish a local team: At the start of the project, we identified stakeholders from the city who could support the SDG localization process. They included the Commissioner and Joint Commissioner; Municipal Corporation, Patiala (facilitating any coordination with the government functionaries); professors from Department of Civil Engineering, Thapar Institute of Engineering and Technology (a local university); and the founder of the Patiala Foundation (a nongovernment organization). TRIPP, IIT Delhi was available for any support and guidance on coordination with the local government.
1b. Consult and identify priorities: In June 2018, OCI and TRIPP convened a meeting with the Commissioner and Joint Commissioner at Municipal Corporation, Patiala, and the stakeholders were consulted to share the most pressing issues of the city. OCI asked the city administrators to shortlist three to four issues that could be tested in the prototype. The city administrators identified five priority areas:

solid waste management
air pollution
parking management
stray animals
road safety (which the city was already
working on in partnership with TRIPP, IIT Delhi).
In August 2018, OCI organized an SDG prioritization workshop in New Delhi with 15 urban experts and practitioners, working within different Indian cities on multiple sectors8. These included experts from UN-Habitat India; the Institute of Social Sciences (ISS); TRIPP, ITT Delhi; the Indian Council for Research in International Economic Relations (ICRIER); the Energy Resources Institute (TERI); the National Institute of Urban Affairs (NIUA); the TERI School of Advanced Sciences (TERI-SAS); and ICLEI South Asia. The objective of the workshop was to showcase and discuss the SDG localization methodology, including the SDG mapping (Step 2b) proposed by OCI.
Participants suggested that city priorities can also be defined through a multi-stakeholder workshop in the city. This is one way to see if the priorities defined by the municipal corporation in the meeting with OCI match with the needs of the citizens. Alternately, the grievances and redressal records can be checked. The registered complaints resonated solid waste management, air pollution, and road conditions as the top pressing issues by citizens. This was validated by the Joint Commissioner, MC Patiala in a meeting in September 2018. The issue with stray animals in the city was mainly raised by the urban local body.

Map selected city priorities to the SDGs
2a. Desk research: To establish an understanding of which SDG and SDG-related indicators have been previously identified by cities, OCI studied literature on SDG localization at the national and global levels and defined a relevant and practical indicator registry. The first go-to resource explored was the official indicators from the IAEG-SDGs. The work done by SDSN under the USA-SCI with three American cities–San José, Baltimore, and New York–was also studied closely to learn approaches to localization and document indicators employed. Further, with the focus on the role of cities for the success of Global Goals, the need for localization is taking center stage, and there are additional literature and toolkits available. Within the Indian context, due to the growing focus on India’s urban transformation, publications like Smart City Bureau of Indian Standards, Liveability Standards, and Service Level Benchmark Handbook, released by the Government of India’s Ministry of Housing and Urban Affairs, were also reviewed.
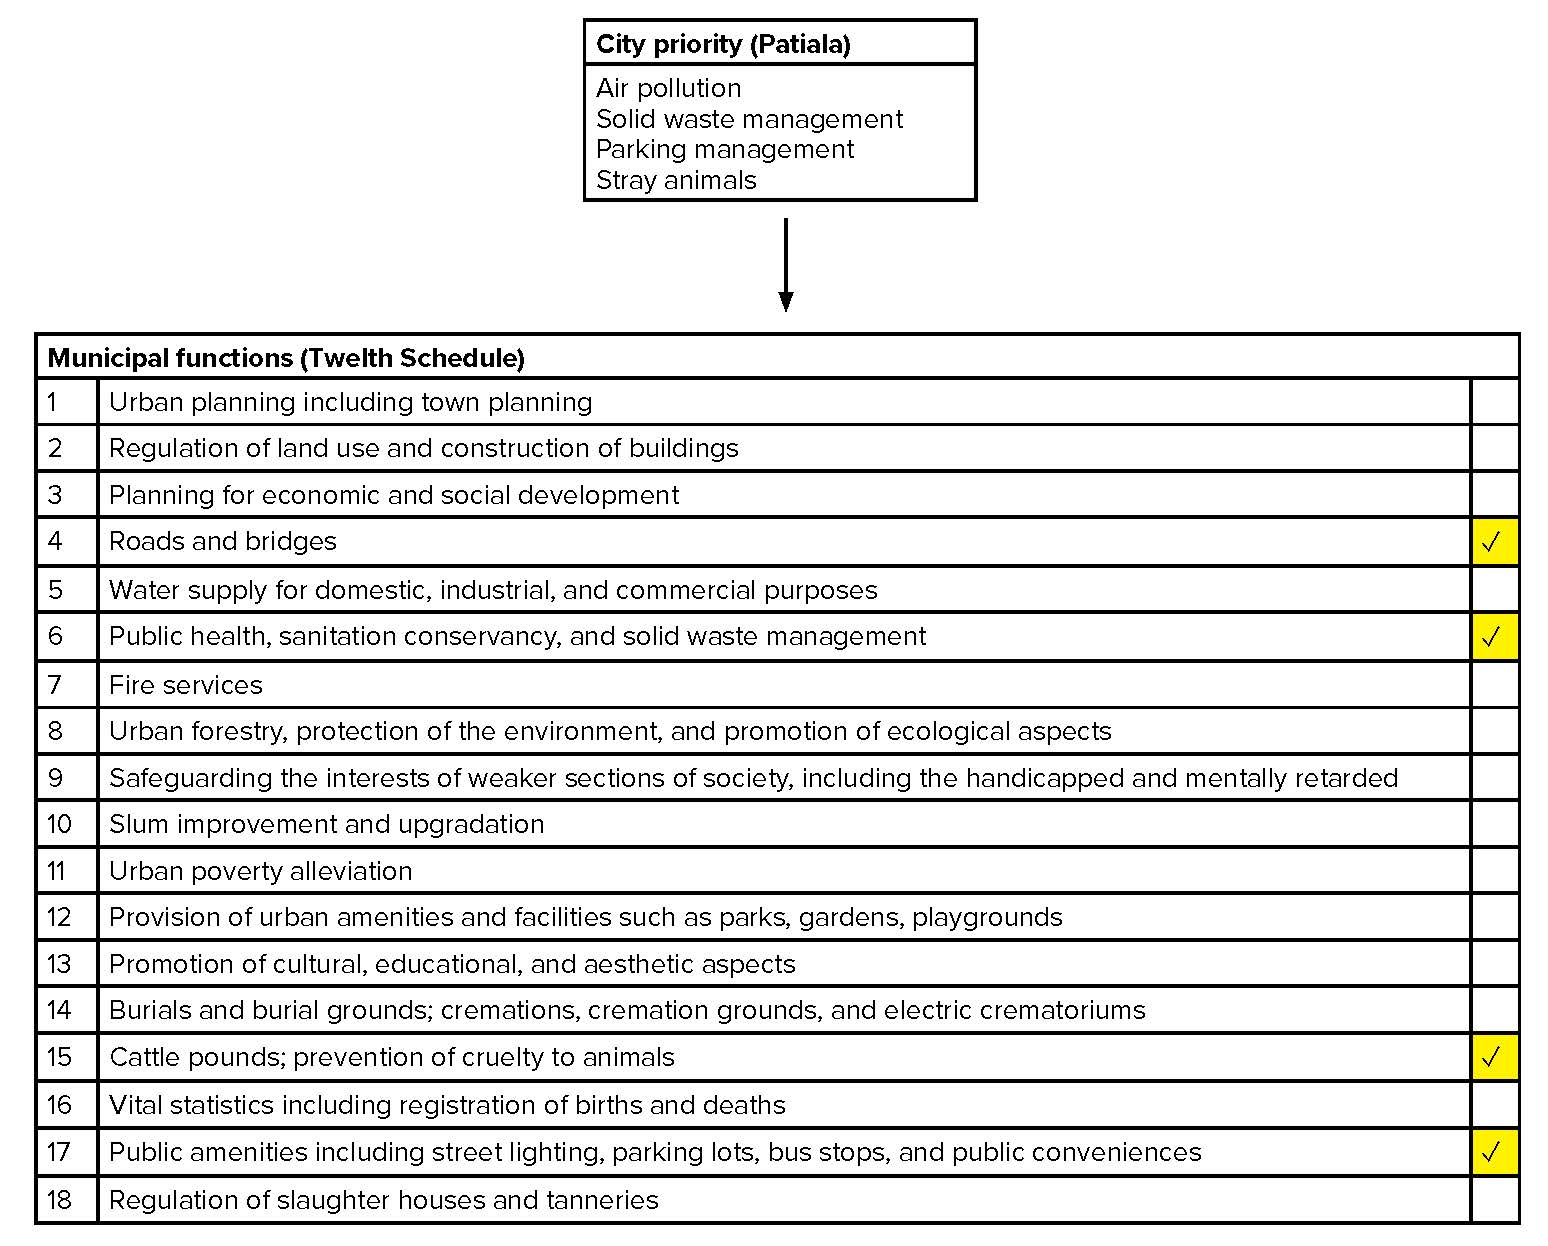
2b. Mapping SDGs to municipal functions: It is critical to develop a consolidated indicator list that resonates with the duties and responsibilities of the urban local bodies. OCI first mapped each city priority to the 18 functions, and then the municipal functions with the relevant SDGs on the basis of similar definition and practical alignment of the goals. The prepared template is available in Annex E. This output was also presented to urban experts in the SDG prioritization workshop so that any missing SDGs could be mapped. Once this was available, it served as a tool to link SDGs to the objectives of municipal priorities and operate within the mandate of the constitutional provisions (Figure 3). The relationship of the city priorities to the municipal functions can vary from one to one, or one to many.
Figure 3. Alignment of City Priorities with Municipal Functions

2c. SDG indicator consolidation for urban local bodies: This step consists of the development of the master list “SDG and SDG-related indicator registry for Urban local bodies in India,” a consolidated registry of indicators (global/official and local) applicable to an urban local body, irrespective of its size, typology, and geography. (See Annexes A and B.) The list offers an opportunity for local administrators to see the relevance of SDGs in their day-to-day planning and governance activities. If more literature or secondary research become available, indicators can be added to the master list, aligning to Step 2b.

Identify Local Indicators and Collect Data
Based on the issues identified, a short list of indicators was prepared for each priority area and shared with the City of Patiala in a data entry sheet (Annex F). Shortlisting indicators will be an iterative process. Indicator selection is primarily driven by what the indicators will be measuring and decision-making aspects of the indicator. Other criteria include:
Relevance: The indicator should be clearly linked to one or more targets/objectives. It should be able to inform policymaking.
Transparency and Ease of Interpretation: The manner in which the indicator is constructed (metadata) should be easily understood, including the rationale behind it.
Measurability: The indicator should be measured in a cost-effective and practical manner; it should be constructed from well-established sources of public and private data, using consistent procedures and calculation methods to make all indicators reliable.
Data Availability: Indicators should include time series data and be based on local data.
Appropriate Time Series: Once indicators have a correct time series, they are reliable.
Reliability: They need to be fit for the purpose under stated conditions for a specified period of time.
Comparability: Can be compared to existing data sets/past conditions.
Validity: This points towards accuracy; the indicator is linked to something conclusive in the evaluation process.
In the case of Patiala, this would depend on availability of data within the city and the applicability of the indicator. The process of localization itself promotes customizing an indicator to make it relevant for the city.
Therefore, at this stage there are two sub-steps:
3a. Apply existing indicators: “SDG localization indicators for Patiala” comprises of 50 indicators (global and local) across issues of Solid Waste Management, Air Pollution, and Parking Management (Annex C). This is a brief concise and smaller list that is applicable to the City of Patiala for the issues identified. A simple view was essential so that it does not intimidate or overwhelm the city.
3b. Designing effective indicators: Effective indicators must be measurable, relevant, reliable, and comprehensible9. It is important that indicators directly measure what they are supposed to, and that they are easily understood by implementers and policymakers alike. If Step 3a is not successful, it is recommended that stakeholders explore and design effective indicators. Step 3b has not been considered as part of the scope and has been defined as a lesson.
A data entry sheet was developed by including both numerator and denominator for the identified indicators. This also assisted in developing a technical understanding on data and statistics with the city administrators, and considers the method of calculations suggested.
The Joint Commissioner, MC Patiala acted as the focal point to provide data values, review indicators, and facilitate any coordination with the relevant departments.
Focusing on the isolated language, the students began the third step: considering whether the structural issue, defined measure, or population could be revised to make the target “applicable.” It is worth noting that the students, with direction from the City, endeavored to include or adapt as many targets as possible in order to maintain the City’s commitment to implement the framework holistically.
How can local government map priority areas NOT directly mentioned in the SDGs?
The Sustainable Development Goals and Urban Local Bodies Toolkit10 mentions the key role of ULBs in implementing the SDGs in India, but also highlights each of the 18 subjects of the ULBs as mandated under the 74th Amendment, directly contributing to the fulfillment of the India’s commitment to SDGs. There are many goals that are directly relevant within the purview of these subjects. OCI observed that for some issues, an indirect relationship exists and it would be difficult for the municipality to address these without any technical assistance. For example, the issues of air pollution and solid waste management are explicitly mentioned in the SDGs, there is good quality research and literature available on them, and cities have been implementing large infrastructural projects to tackle these issues, whereas for other identified issues (such as parking management and stray animals), there is little or no mention in the SDGs.

Box 2: Parking Management
Issues such as parking management need to be critically addressed from the lens of sustainable urban mobility principles. In the case of parking management, most of the indicators identified have been populated through national-level documents. Finding indicators was not the primary challenge, but rather selecting the right indicator for the issue.
The steps being taken by the administration are oriented towards responding to the immediate needs of citizens through the creation of parking lots, road widening, and other capacity enhancement strategies. The SDGs place the principle of “leave no one behind” at the heart of the new agenda, aiming to ensure the inclusion of marginalized, disempowered, and excluded groups. Also, Target 11.2 states, “By 2030, provide access to safe, affordable, accessible and sustainable transport systems for all,” particularly public transport solutions. If cities want to adopt the goals, it is critical to track/report on the right indicator that reinforces a people-centric vision and promotes development of long-term strategies, such as improving and prioritizing public transport, cycling, and walking.
Therefore, while selecting localized key performance indicators for parking management, the SDGs offer Patiala an opportunity to steer towards for a paradigm shift in the way the city is planned and become accountable to more sustainable modes across the city.

Box 3: The Case of Stray Animals11
One of the 18 subjects for the ULB is specific to “cattle pounds, prevention of cruelty to animals.” The case of stray animals is not specific to Patiala. The last few years have seen a rise in the number of stray animals in Indian cities, leading to greater traffic congestion and accidents, public safety and health issues, and cases of animal cruelty and death. The animals involved range from common domestic animals (like dogs, cows, monkey, and pigs) to wild (and sometimes bigger) animals–such as elephants or leopards–depending on the proximity of the city to their natural habitats. Each species requires a specific study on why its numbers are rising, the nature of its interaction with humans, the threats posed and faced by the species, and possible strategies to deal with them in a humane manner.
Patiala city administrators specifically mentioned the problem of stray dogs and cattle in the city. While this issue itself is not explicitly mentioned in the SDGs, the causal factors and the impact of these are linked to various SDGs and targets (Figure 4). One of the greatest contributing factors to the rise in the population of stray animals is the greater availability of food to them through growing garbage dumps and more open dumping sites. In the case of cattle, the issue is further compounded by political and religious tensions, with a rising number of cases, hate crimes, and deaths in India. Indian farmers rely on the beef-leather by-product market to dispose of their unproductive animals, sustain their livelihoods and the “dairy-draught-insurance-manure-role” of the animal in Indian agriculture, for which slaughter is a prerequisite12. The all-out ban on cattle slaughter by the central government has led to a greater number of old cows being abandoned, as farmers are unable to meet the required costs for looking after them. In turn, the municipal government is grappling with a rising number of cows in state-run shelters and on the streets.
Figure 4. Linkages Between Stray Animal Issue and SDGs

In Patiala and other Indian cities, priority areas such as stray animals not only have no precedent in terms of existing localized indicators but also are difficult to place within the SDGs themselves. This poses the challenge of not just developing indicators for which data is available, but first placing the issues within the SDGs in order for the indicators to support SDG monitoring.
The issue of stray animals, particularly dogs and cattle, in Patiala has been reviewed through a systems thinking approach. While the political, social, and cultural reasons linked to this issue deserve to be studied in detail, the time scope of the grant did not allow for further detail. Rather, OCI approached this issue by breaking it into its various parts – the causes, impacts, possible responses, and how each of these affects the other. The aim of this process was to understand which SDGs would best answer the causal factors, and which may help mitigate the impacts. The relationship of this issue thus could be linked to SDG 3: Good Health and Well-being, SDG 6: Clean Water and Sanitation, SDG 11: Sustainable Cities and Communities, and SDG 15: Life on Land.


Adoption of data visualization tools and dashboard development
The adoption of data visualization tools and dashboards valorizes the SDG localization process. CSF and its Data for All13 initiative support a modular approach of loosely coupled, yet tightly aligned, opensource tools to support national and sub-national SDG monitoring.
Once the data entry sheets (shared in Step 3) were received from the city, OCI computed the indicators’ value and converted the datasets into meaningful visualizations, presented in the dashboard. The prototype can be seen online and in Figure 5 (also, Annex D).
The KPIs selected from the datasets enabled the introduction of SDG 6: Clean Water and Sanitation on the dashboard. Indicator 6.3.1: (“Proportion of wastewater safely treated”) and Indicator 11.6.1 (“Proportion of urban solid waste regularly collected and with adequate final discharge out of total urban solid waste generated, by cities”) were added. The final dashboard was reviewed by the Joint Commissioner. Since only two out of 48 indicators shared could be reported, the need for data consistency, data collection, and reporting emerged.
The public dashboard, once fully available online, can bridge the gap between citizens and the municipal corporation. Thoughtfully-designed data visualizations, broadly accessible on the web and updated in real time, restore priority to the issues identified through the localization process. They expand support for these through the city administration and with citizens (if the tool is publicly accessible). The potential of the mock dashboard will be fully realized once taken online.
Figure 5. Mockup of Prototype Public Data Dashboard

Strengths and Weaknesses
Intuitive and simple methodology
The methodology to develop these tools is extremely intuitive, simple, and feasible. Cities can quickly develop iterations and see alignment of their priorities with the Sustainable Development Goals. The city administration and decision-makers have dropped any initial skepticism around Agenda 2030 as something imposed by an international body to drive sub-national priorities. This increases ownership by the city and excites them to evaluate this in other sectors like water and public places.
Currently, the SDGs shortlisted are SDG 3: Good Health and Well-being, SDG 6: Clean Water and Sanitation, SDG 9: Industry, Innovation and Infrastructure, SDG 11: Sustainable Cities and Communities, SDG 13: Climate Action, and SDG 16: Peace, Justice and Strong Institutions. The city realizes SDG 13 and SDG 16 have a broader role, especially to foster environmental sustainability and transparent, robust urban governance. The role of SDG localization is thus not only limited to data impact. Currently, Patiala uses the Agenda 2030 as a guiding light.
Data dashboard as a launchpad for long-term vision and integrated development
Adopting innovative data tools, such as a dashboard, provides a common ground and promotes localized targets and results-based approaches. Using data visualization technology and design, an SDG localization project evolves into a living reference dashboard and presents an opportunity to invest in data tools to increase accountability and monitoring. The commissioner’s office is able to employ the SDG Dashboard, emphasizing tight integration of departments around a shared set of priorities. The current dashboard includes information collected from eight departments, namely: Police, Municipal Corporation, Punjab Pollution Control Board, Public Works Department, Water Department, and Solid Waste Management Department.
The power of collaboration and partnerships
The role of partnerships was key in this process. The prototype dashboard is an excellent output showcasing work by multiple partners working on the common objective to mainstream Agenda 2030. With the data was collected under respective projects, the city was able to see the SDG framework at work. The city constantly received technical assistance from CSF’s OCI on data systems and academic partners such as TRIPP, IIT Delhi and Thapar University (on SDG-oriented road safety, air pollution, transport related SDGs), who supported data collection and analysis, and collectively bridged understanding on the SDGs when required. With the support of the LDA-SI grant and support by SDSN TReNDs, the city was able to expand into other SDGs and develop the prototype dashboard.
Online, real-time dashboard tool
The prototype dashboard has been produced as a standalone webpage that can be disseminated widely. This is a step forward from the traditional methods of information sharing in the city.
Funding and technical capacity
Although lacking state support and possessing limited resources and technical capacity, this small city has kickstarted its journey with the SDGs. It can now reach out to state governments, urban missions, and donor agencies for additional funds and to create partnerships for full-scale SDG local data action, data implementation, and technical assistance.
Data availability and data consistency
OCI has been able to visualize two more indicators under this method to showcase what is available rather than what is not. The city understands that with the provision of new datasets, the type of visualization can change. At present, only the previous year’s data points have been included for some indicators.
Lessons
Enabling local government to apply the SDGs to their context
OCI leveraged the LDA-SI microgrant to develop a proof-of-concept package for Indian cities, kickstarting localization of the goals and leveraging of open-source data technology to valorize local data action across constituencies. While the success of the method has been acknowledged by the Patiala city government through their interest in exploring other priority areas, the official data that emerged after the exercise was underwhelming. In the data entry sheet, Patiala was only able to fill data for the current year for three out of 48 indicators; the datasets were inconsistent and were mainly estimates provided by the Urban Local Body.
The scope was designed in such a way that official datasets could be visualized to empower ULB to start opening more datasets. With a lack of official datasets received, the team could rely on collection of non-official datasets resting with NGOs or civil society organizations, or also look at citizen-centered data. As mentioned, the process of identifying indicators is iterative, and this would link to defining efficient indicators. This is a learning that can be incorporated in the next iteration, and appropriate time and resources can be allocated to bolster local data action efforts.
Lacking human resources and technical capacity within the city were made clear in the process of extracting and reporting data from old, paper-based records. To bring efficiency in this process, the city has also seen the potential of an online data entry and management tool that can be shared with all departments for easy data collection. This will also facilitate digitization of records, timely provision of information at the time of decision-making, and development of a robust SDG implementation.
The mock dashboard itself can only help in generating an initial interest and curiosity from citizens and government counterparts. To drive proactive decision-making, taking the dashboard online is eminent. Further facilitating a real-time data update will be extremely instrumental. Supporting this with a sustainability officer or other resource, looking at data within the municipal body, will create the momentum to continuously supply evidence to the decision-makers, disrupting “business as usual” urban planning and targeting a results-based approach to city governance.
A need for collaboration and convergence of existing programs and schemes
The prototype dashboard is a strong tool that supports a shift to collaborative decision-making. It indicates that urban development as a sector is cross-cutting, thereby not only a mandate of municipal corporation but a collaborative effort of various state departments and parastatals. Not only does such a tool address the priorities of the city and benefit the municipal corporation, it can also serve to fill information gaps and enable policy planning by state and national governments for facilitated action toward SDG target achievement.
There are various programs and schemes available at the national and state level, yet many such programs are not able to support or bypass city priorities. While some GoI programs such as Smart City Mission (SCM), HRIDAY might be exclusive or not apply directly to cities that were not selected, others such as Swacch Bharat (Urban) Mission, Atal Mission for Rejuvenation and Urban Transformation (AMRUT), Pradhan Mantri Awas Yojana - Urban (PMAY-U), etc. can support cities building strategies to achieve the SDGs. As India drafts its urbanization story, such innovations at local level will not only be appreciated within the state, but have immense potential for replication in similar cities.
Local SDG reporting can complement India’s VNR process
NITI Aayog is also leading the process of Voluntary National Review (VNR) preparation. VNRs are not an end, but a means to exchange experiences, identify challenges, and accelerate implementation14. As a member state of the UN, India presented its VNR on SDGs 1, 2, 3, 5, 9, and 14 during the 2017 HLPF. NITI Aayog has been encouraging states and union territories across the country to share good practices that can fast-track implementation of SDGs. The VNRs enable sharing of experiences, challenges, and lessons learnt so as to accelerate SDG implementation. The outputs and the SDG localization package can be discussed by the state government in VNR processes. Also, while the proof-of-concept package assists any city in launching a prototype of its own evidence-based journey towards SDG localization, the gaps, challenges, and full-scale impact can be bolstered through participation of the state government.
References and Additional Resources
Aijaz, Rumi. 2007. “Challenges for Urban Local Governments in India.”
http://www.lse.ac.uk/asiaResearchCentre/_files/ARCWP19-Aijaz.pdf.
Global Taskforce of Local and Regional Governments, UN-Habitat, and UN Development Programme. 2016. Roadmap for Localizing the SDGs: Implementation and Monitoring at Subnational Level. https://www.uclg.org/sites/default/files/roadmap_for_localizing_the_sdgs_0.pdf.
Government of India. 2017. “Voluntary National Review Report: On the Implementation of Sustainable Development Goals.” https://sustainabledevelopment.un.org/content/documents/15836India.pdf.
Government of India Ministry of Housing and Urban Affairs. n.d. “Handbook of Service Level Benchmarks.” http://www.asci.org.in/sslb/SLB%20toolkit.pdf.
Government of India Ministry of Urban Development. 2017. “Liveability Standards in Cities.” http://smartcities.gov.in/upload/uploadfiles/files/LiveabilityStandards.pdf.
Nixon, Hilary, and Sandra Ruckstuhl. 2016. “San José: Implementing the UN’s Sustainable Development Goals at the Local Level.” http://www.sjsu.edu/sustainable-cities/docs/sci-reports-sanjose-final.pdf.
Press Trust of India. 2017. “India Ranks 116 out of 157 Nations on SDG Index.” The Economic Times, July 13, 2017. https://economictimes.indiatimes.com/news/economy/indicators/india-ranks-116-out-of-157-nations-on-sdg-index/articleshow/59582186.cms.
Press Trust of India. 2018. “Success of Sustainable Development Goals Depends Entirely on India: Puri.” Business Standard, July 18, 2018. https://www.business-standard.com/article/current-affairs/success-of-sustainable-development-goals-depends-entirely-on-india-puri-118071800284_1.html.
Ramdas, Sagari R. 2017. “Modi Government’s Stance on Slaughter Proves It Doesn’t Really Care About Cows.” The Wire, September 26, 2017. https://thewire.in/politics/modi-government-cow-slaughter-stray-cattle.
Ruckstuhl, Sandra, Jessica Espey, and Leslie Rae. 2018. “The USA Sustainable Cities Initiative: Lessons on City-Level SDG Action.” http://unsdsn.org/resources/publications/usa-sustainable-cities-initiative-lessons-for-city-level-sdg-action.
The City of New York. 2015. “One New York: The Plan for a Strong and Just City.” New York. http://www.nyc.gov/html/onenyc/downloads/pdf/publications/OneNYC.pdf.
University of Baltimore, and SDSN. 2016. “Baltimore’s Sustainable Future: Localizing the UN Sustainable Development Goals, Strategies and Indicators.” http://localizingthesdgs.org/library/297/Baltimores-Sustainable-Future-Localizing-the-UN-Sustainable-Development-Goals-Strategies-and-Indicators.pdf.
UN Resident Coordinator’s Office India and UN-Habitat India. 2018. “Sustainable Development Goals and Urban Local Bodies – The Future We Want.”
UN Statistics Division. n.d. “SDG Indicators.” https://unstats.un.org/sdgs/indicators/indicators-list.
UN Statistics Division. 2015. “Discussion Paper on Principles of Using Quantification to Operationalize the SDGs and Criteria for Indicator Selection.” February 2015. https://unstats.un.org/unsd/post-2015/activities/egm-on-indicator-framework/docs/Background%20note_Principles%20of%20using%20quantification%20to%20operationalize%20the%20SDGs%20and%20criteria%20for%20indicator%20selection_Feb2015.pdf.
Varma, Ruchi. 2018. “Making Localization Matter: The Power of Local Data Action.” Community Systems Foundation Blog. September 26, 2018. https://www.communitysystemsfoundation.org/impact/making-localization-matter-the-power-of-local-data-action.
Woodbridge, Michael. 2015. “Measuring, Monitoring and Evaluating the SDGs.” http://localizingthesdgs.org/library/236/ICLEI-SDGs-Briefing-Sheets-06-Measuring-Monitoring-and-Evaluating-the-SDGs.pdf.
Annexes
Annex A. Template for SDG Alignment to Municipal Priorities
Annex B. Local Registry
Annex C. SDG-Oriented Local Indicators for Patiala
Annex D. SDG Data Dashboard Mockup

Annex E. Template for SDG Alignment to Municipal Priorities
Annex F. Data Entry Sheet
Endnotes
1. In 2018, the city of Patiala in Punjab was supported with the development of a prototype dashboard on mobility by mapping First Hand Information Reports of Police (FIR’s) on road accident data and using indicators to map transport related SDG. The dashboard was developed by OpenCities Institute while data collection and analysis was conducted by Transportation Research and Injury Prevention Programme at Indian Institute of Technology, Delhi. (http://tripp.iitd.ernet.in)
2. Press Trust of India. 2018. “Success of Sustainable Development Goals Depends Entirely on India: Puri.” Business Standard, July 18, 2018. https://www.business-standard.com/article/current-affairs/success-of-sustainable-development-goals-depends-entirely-on-india-puri-118071800284_1.html.
3. Census of India, 2011.
4. UN Resident Coordinator’s Office India and UN-Habitat India. 2018. “Sustainable Development Goals and Urban Local Bodies – The Future We Want.”
5. Aijaz, Rumi. 2007. “Challenges for Urban Local Governments in India.” http://www.lse.ac.uk/asiaResearchCentre/_files/ARCWP19-Aijaz.pdf.
6. Press Trust of India. 2017. “India Ranks 116 out of 157 Nations on SDG Index.” The Economic Times, July 13, 2017. https://economictimes.indiatimes.com/news/economy/indicators/india-ranks-116-out-of-157-nations-on-sdg-index/articleshow/59582186.cms.
7. UN Statistics Division. n.d. “SDG Indicators.” https://unstats.un.org/sdgs/indicators/indicators-list.
8. Varma, Ruchi. 2018. “Making Localization Matter: The Power of Local Data Action.” Community Systems Foundation Blog. September 26, 2018. https://www.communitysystemsfoundation.org/impact/making-localization-matter-the-power-of-local-data-action.
9. Woodbridge, Michael. 2015. “Measuring, Monitoring and Evaluating the SDGs.” http://localizingthesdgs.org/library/236/ICLEI-SDGs-Briefing-Sheets-06-Measuring-Monitoring-and-Evaluating-the-SDGs.pdf.
10. Ibid.
11. Research inputs contributed by Ms. Jayati Narain in her capacity as a Research Associate, OpenCities Institute, Community Systems Foundation.
12. Ramdas, Sagari R. 2017. “Modi Government’s Stance on Slaughter Proves It Doesn’t Really Care About Cows.” The Wire, September 26, 2017. https://thewire.in/politics/modi-government-cow-slaughter-stray-cattle.
13. www.dataforall.org.
14. Report presented to the High-level Political Forum on Sustainable Development, New York, July 2017: “India: Voluntary National Review Report on the Implementation of Sustainable Development Goals.” Available at: http://niti.gov.in/writereaddata/files/Final_VNR_report.pdf.